
Introduction
Azure Stream Analytics is a Complex Event Processing (CEP) Platform as a Service (PaaS) in Azure. In the series of this blog posts we’ll examine a scenario which helps us understand the CEP capabilities of the Azure Stream Analytics.
Before we begin, let’s have a basic understanding of what CEP is. CEP is any technology that can process the streams of events along with static data. The ability to process both the streaming events and the static data in real-time by combining them in some sort of computation is the key for CEP. In addition to this idea, commercial CEP tools have other auxiliary capabilities like storage, event publishing and etc.
Almost all the major public cloud vendors provide CEP as service under different product names. CEP platforms require large memory and computational power – which are abundant in the cloud. This is possible by the economies of scale of data center infrastructure. This makes the public cloud vendors to offer CEP as service at lower cost than on premise implementations.
Case introduction to the series
Azure Stream Analytics is a managed service, which has a simple process model with input, query processing and output pipelining.
Let’s take a case of a nuclear reactor; there are pipes which carry the water used to cool down the nuclear reactors. In one particular nuclear plant assume there are 16 pipes and each pipe has sensors which detect the temperature of the inner shell of these pipes.
These sensors send temperature data to the cloud, in the cloud we analyze the data with reference data which have more details of the pipes like pipe location, owner for the maintenance and etc. When the average temperature of a pipe goes more than 85 degrees of Celsius within 300 seconds window, then the pipe maintenance owner should be alerted.
Getting started with Stream Analytics
Stream Analytics will get the stream of events from Events Hub, it gets the reference static data from Storage. When the specific condition is met, it will post a message in the Service Bus Queue, this can be consumed by any other applications. (Serverless Functions – but I had a real mess with the VS tooling. Read more about that from here) So removing that from the series of this blog post and adding Logic Apps)
In order to do this, first we have to set up the following Azure resources.
- Event Hubs
- Storage Account
- Azure Stream Analytics Unit
- Azure Storage account
- Service Bus
Azure FunctionsLogic Apps
The below image describes the high level picture of the explained setup.

In this part of this series. Let’s plug the streaming data input and try the CEP query in a minimalist way. Navigate to the Stream Analytics service and add the Event Hubs (temperatureinput) as input. You can do this by clicking on the Input box and selecting the source in the relevant form in the Azure portal.
After adding the input, select the Query from the Job Topology section.

Before testing on the event data we can upload a sample file which represents the events and try the query. Assume the below JSON object is the sample event which represents a single reading from a sensor.
{
"DeviceId":"4a2afe86-b4e4-4f42-bce6-1b04be499a3a",
"PipeCode":"4",
"Temperature":82,
"DateTime":"2017-08-30T04:50:32.9830513Z"
}
We will feed a sample set of above events from a file and try the CEP query. This sample file has 100 readings like the above one. You can download the sample file from this link.
Click on the Query in the Job Topology and you can upload the sample file in the input feed. Then we can write the query to satisfy our condition. Click the Test button to run the query.
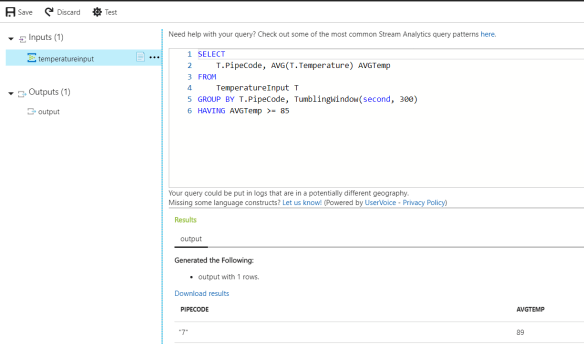
SELECT
T.PipeCode, AVG(T.Temperature) AVGTemp
FROM
TemperatureInput T
GROUP BY T.PipeCode, TumblingWindow(second, 300)
HAVING AVGTemp >= 85
The query is similar to the SQL syntax. The key aspect is the windowing concept. Since we’re dealing with the stream of data we have to specify a window to get the result of a specific time frame. Read more about windowing from this link.
So in the result you can see one pipe with the pipe code 7 has an average temperature greater than 85. Which is shown in the portal.
